MCP security scan toolkit: scan, inspect, compliance check
MCP security scan, inspect, compliance check: three dashboard tools for shipping safer MCP servers. What each catches and how they fit a real workflow.
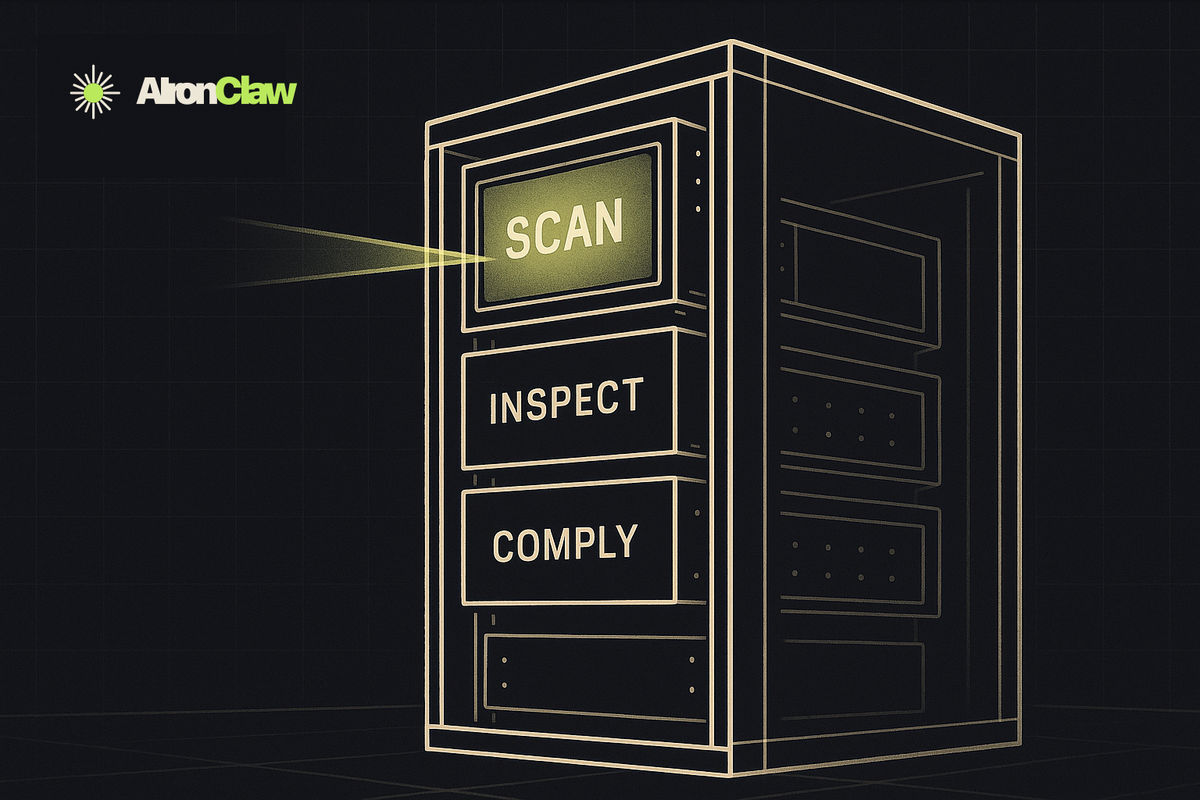
TL;DR: AIronClaw ships three free tools for MCP servers: a security scan that probes every tool with OWASP MCP Top 10 and out-of-band payloads, an Inspector that drives any JSON-RPC call by hand, and a compliance check that verifies the server obeys the Streamable HTTP spec. Together they give you a confident-to-ship gate for any new or existing MCP server.
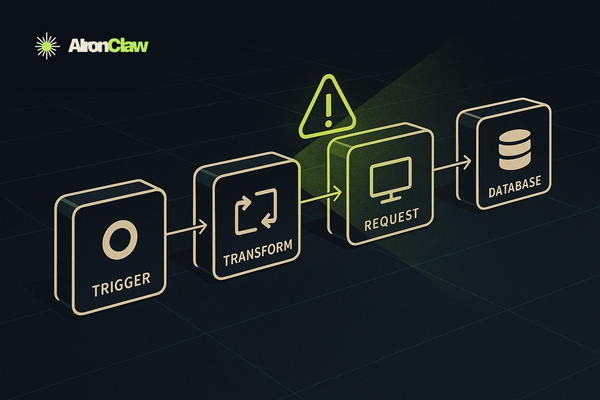
You wire up an MCP for the customer database. The first thing the agent does is call get_customers with a user name. Weeks later someone notices an odd line in the API log: customer_name=foo' OR 1=1--. The whole table walked out. The agent was the delivery vehicle. The bug was in the tool: string concatenation into a SQL query, no parameter binding, no input filter.
This is the kind of problem an MCP security scan exists to find before any of it ships. The AIronClaw dashboard now bundles an MCP security scan with two companion tools that, used together, get you most of the way there. The MCP security scan drives real payloads through the proxy. An inspector handles hand-crafted requests and saved repros. A six-probe compliance check verifies the server speaks the protocol the spec defines. This post walks all three and shows how they line up against a real workflow.
What does the AIronClaw MCP security scan do?
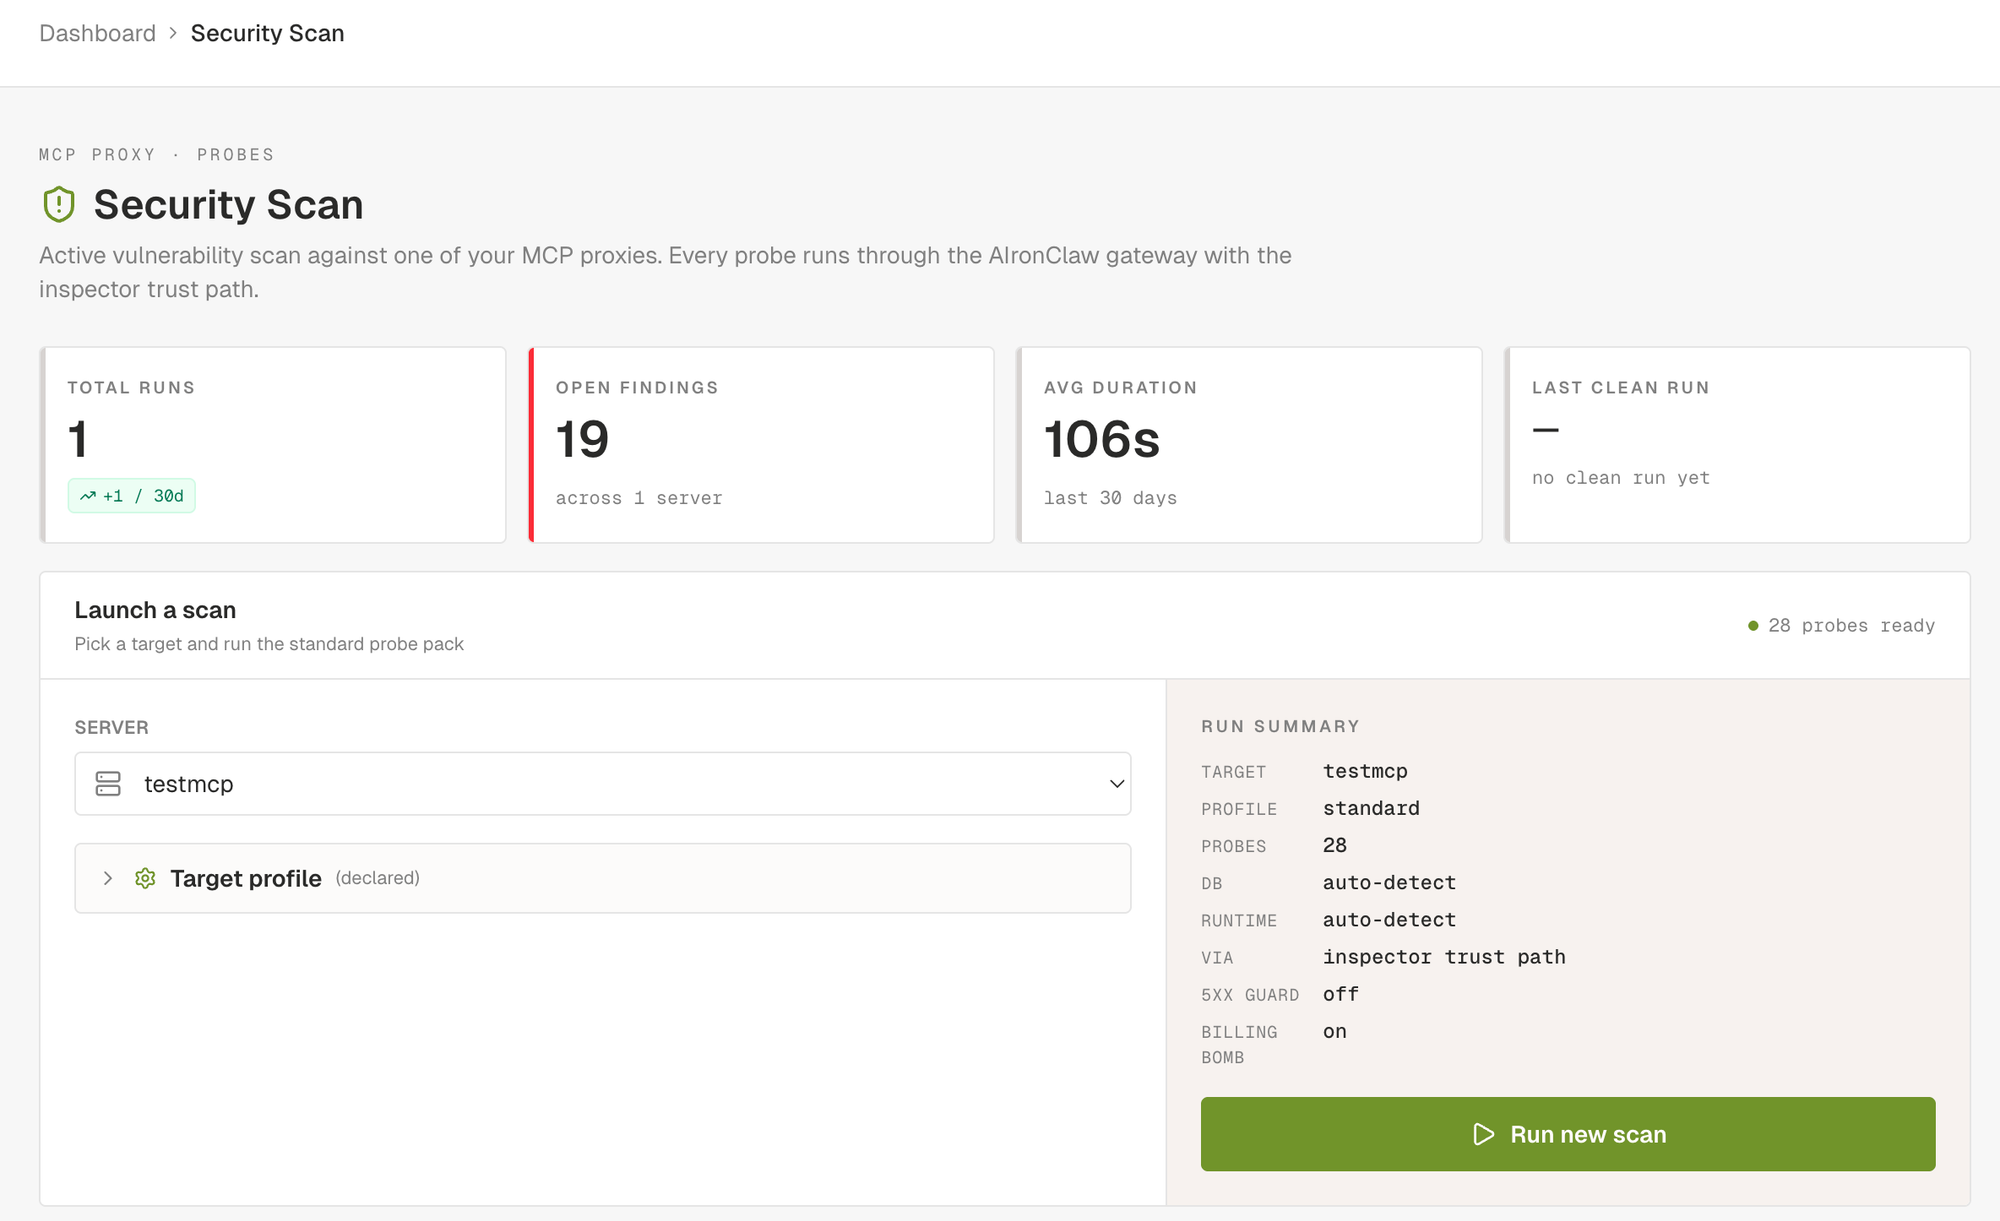
The MCP security scan is the loudest of the three. You pick one of the MCP proxies you have configured, click Run new scan, and the scanner drives a curated set of probes through the AIronClaw gateway against every tool the proxy exposes. The run is queued immediately and progress streams into the dashboard in real time: probes start, requests fly, findings land as the detector confirms them.
The scanner ships around forty probes today, grouped in eight families. Each family targets a specific class of weakness.
- Protocol probes hit spec compliance at the JSON-RPC layer. Bogus methods, malformed arguments, invalid session ids, notifications carrying ids they shouldn't carry.
- Transport probes look at HTTP hygiene. CORS wildcards, open preflights, verbose server banners.
- Authentication probes try the obvious bypasses. No credentials. Empty bearer. Common weak tokens from a wordlist. JWT with
alg=none. BFLA on tools whose name screams admin (delete_user,grant_role,drop_index). - Fuzz probes pick the field most likely to be a payload sink and walk through curated packs. SQL injection covers error-based and boolean-blind. Command injection covers thirty plus shell separators, IFS bypasses, URL-encoded variants, Windows quoting. Path traversal, XSS, format strings, integer edge cases, header injection, open redirect, mass assignment. SSRF probes target internal addresses and the Docker bridge with the common service ports.
- BOLA-lite probes hit broken object-level authorisation. Tools that accept arbitrary object ids without checking who's asking.
- Canaries look at the tool catalog itself. The rug-pull canary diffs the tool descriptions across two
tools/listcalls. The poisoning regex hits known injection patterns in descriptions. The hidden-instructions canary catches zero-width characters, bidi overrides, and ANSI escape sequences that smuggle invisible instructions past a human reviewer but stay visible to the agent. - CVE replays are single-purpose checks tied to specific advisories. They confirm the exploit live, not on a version-string match. The CVE catalog is refreshed daily.
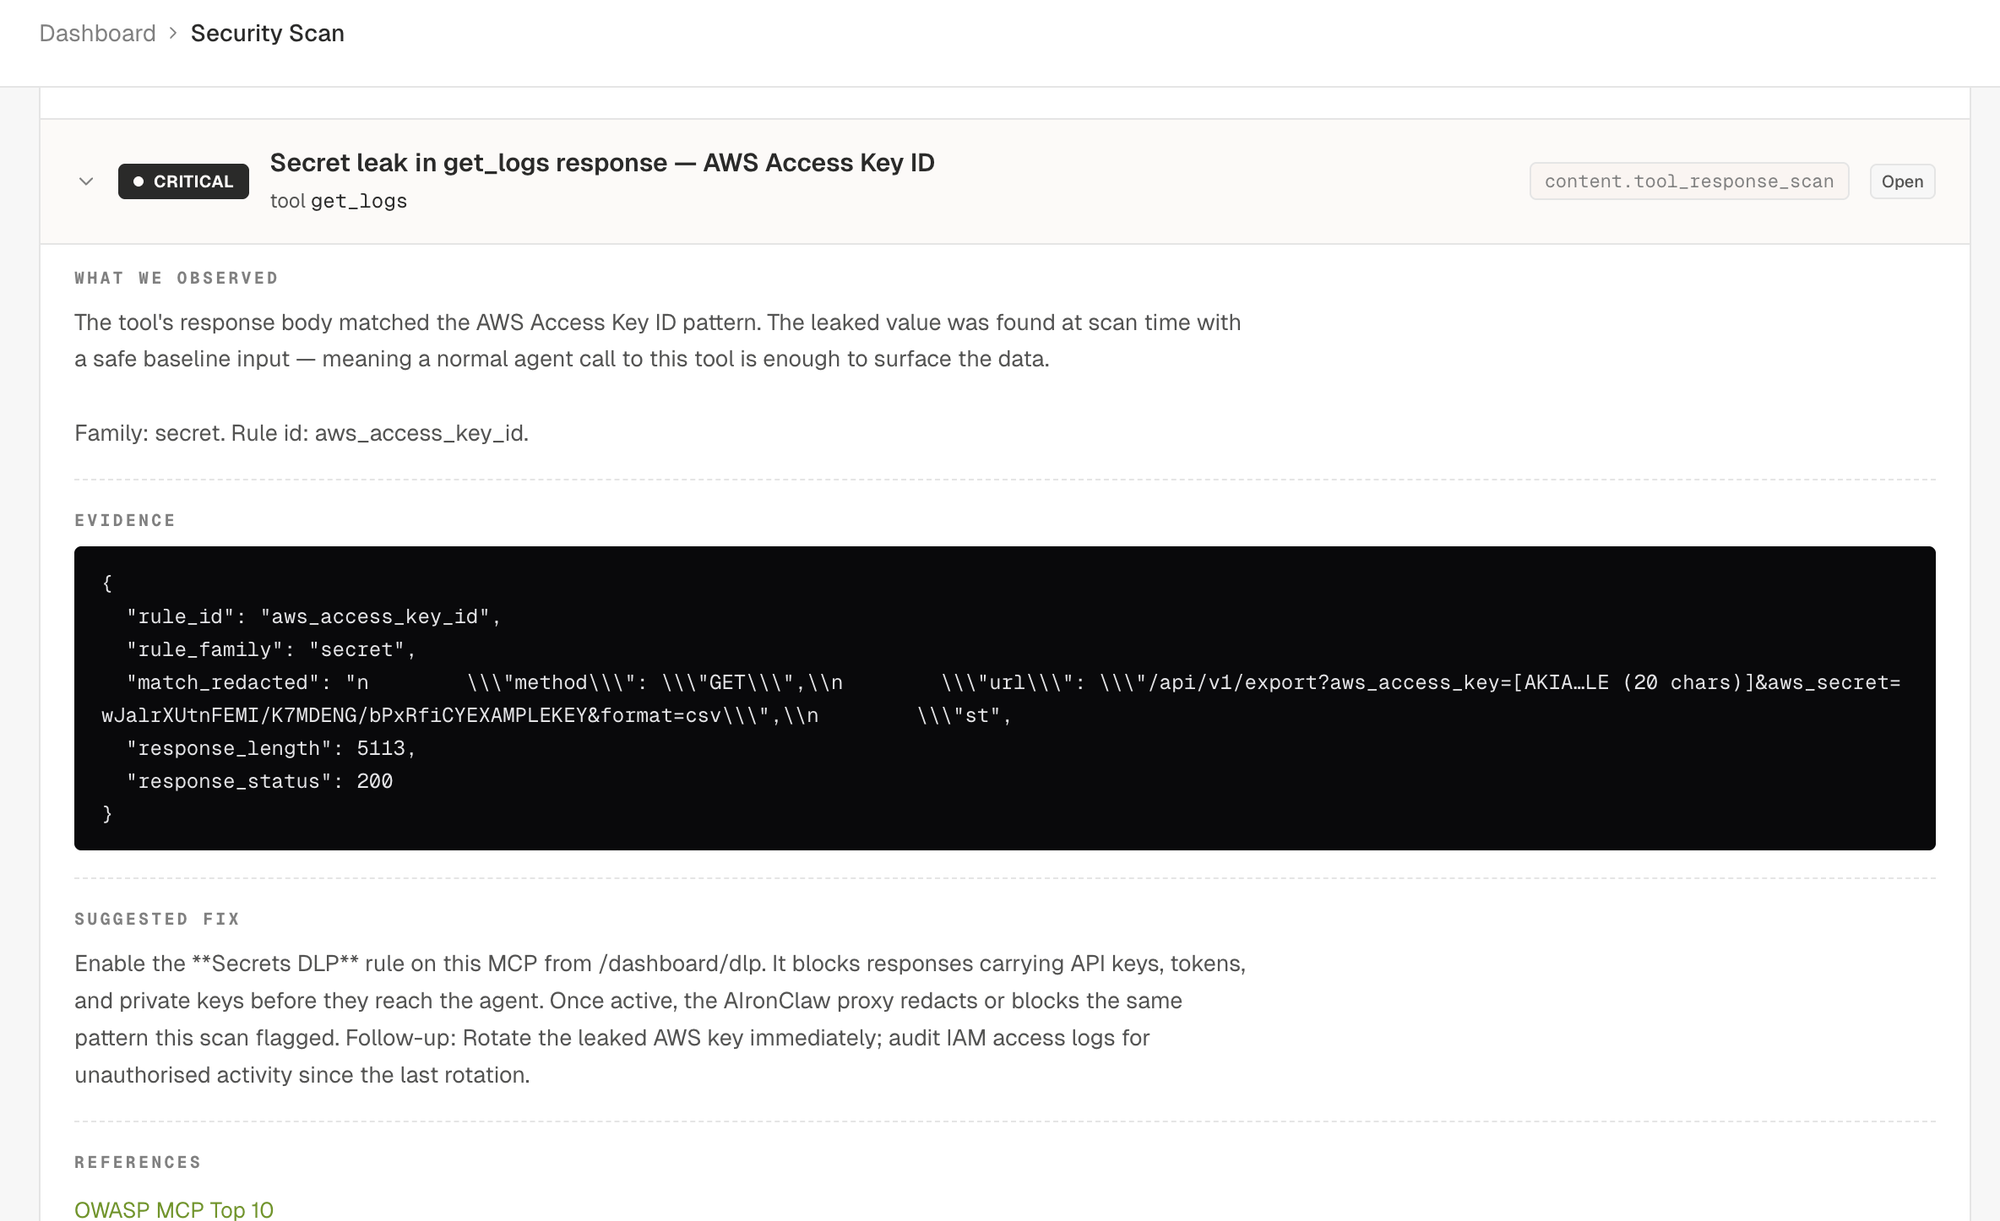
- Content scan calls each tool with safe baseline inputs and runs the response through DLP detectors: AWS / GitHub / Slack / Stripe / OpenAI / Google keys, JWT and PEM blobs, credit cards with Luhn validation, IBAN with MOD-97, US SSN, indirect prompt injection markers, raw HTML or JavaScript that could trigger XSS in a rendering agent client.
- Behavioural probes test concurrency and rate limiting. The race-condition probe fires five identical envelopes in parallel against create-like tools to see if idempotency holds. The billing-bomb probe (opt-in per MCP) sends twenty parallel calls against tools whose name suggests an expensive backend (
search_*,generate_*,embed_*,llm_*) to surface missing rate limits. - Out-of-band probes cover the blind classes. The scanner generates a unique callback hostname per payload, injects it into commands that would shell out (
; curl http://<host>,nslookup,wget,certutil,Invoke-WebRequest), SQL fragments that ask the database engine to issue an outbound DNS or HTTP query (PostgresCOPY TO PROGRAM, MSSQLxp_dirtree, MySQLLOAD_FILEover UNC, OracleUTL_HTTP), and XML payloads referencing external DTDs. Any DNS or HTTP callback at the sink during the run binds back to the probe that armed it. A callback is positive proof of execution even when the upstream returns no output.
Every confirmed finding ships with: severity, title, affected tool and field, OWASP and CWE and CVE references, description, evidence (response excerpt plus signal breakdown), a copy-pasteable proof of concept (curl plus JSON-RPC envelope), a remediation paragraph, and, when the finding maps to a known mitigation, a suggested rule block ready to paste into the proxy's rules.
Severity is honest. Five levels. Critical means confirmed exploit (uid=-shaped output reflected, OOB callback received, secret returned from a tool). High means strong evidence under realistic conditions. Medium means probable but uncorroborated, or behavioural (racing past an idempotency check). Low covers hardening (verbose banners, missing schema constraints, agency surface). Info is observational, used for capability mapping and similar passive notes.
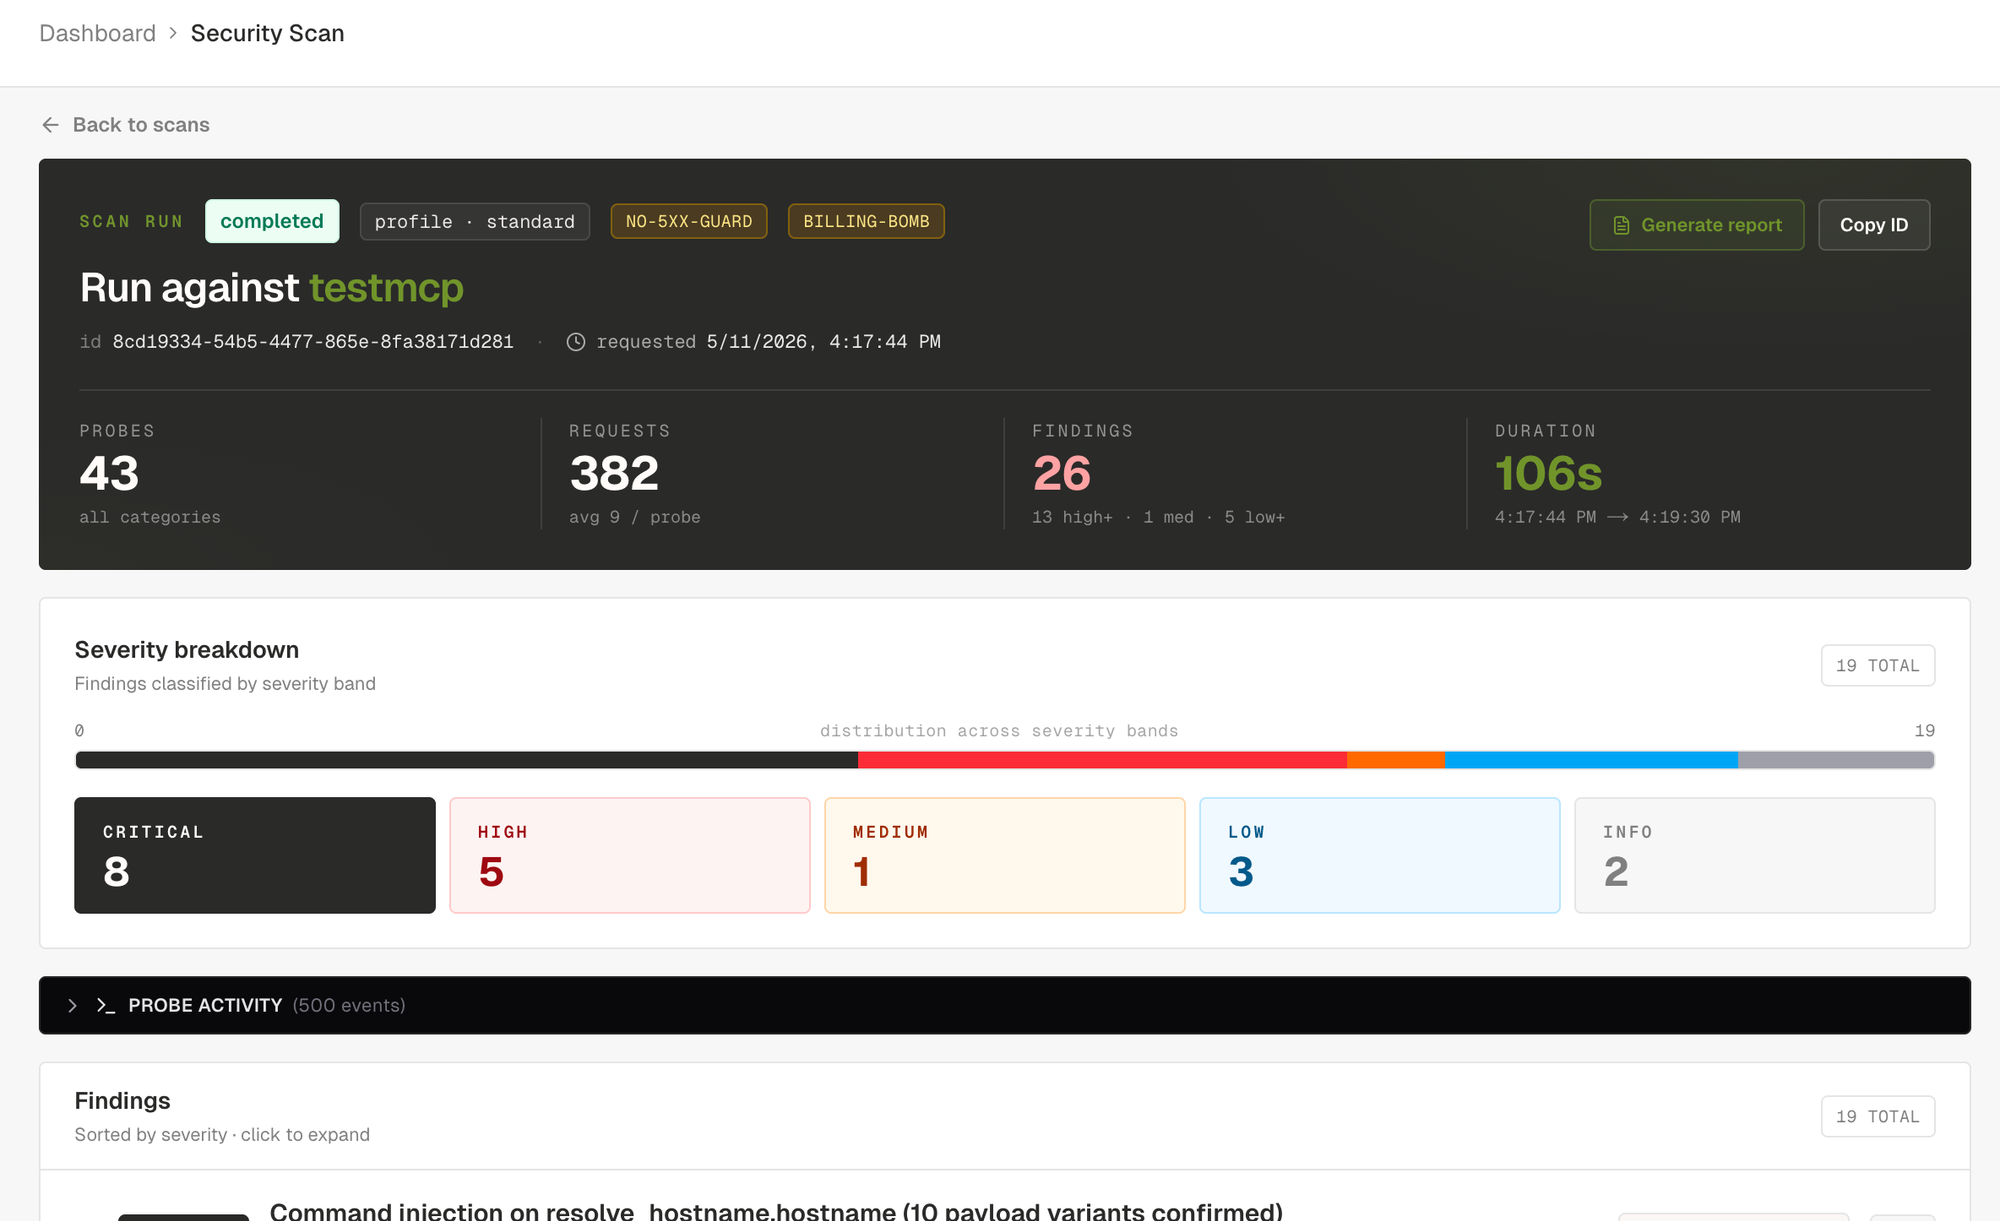
The severity breakdown surfaces the run posture at a glance. Below the tiles, the findings list opens straight on the worst items and you can click into any of them.
You can narrow the scan by setting a target profile on the MCP before running. Database family, backend runtime, hosting (AWS, GCP, Azure, on-prem), declared tool surfaces (filesystem, shell, db_query, http_client, mailer, browser). All optional. When set, the scanner narrows payload packs to the declared stack (Postgres-only error tokens, no MySQL noise), boosts targeted canaries (mailer enables the Bcc-smuggler check), and skips fingerprinting requests. Two extra knobs sit on the profile: disable 5xx abort guard for upstreams that legitimately error on fuzz input (n8n, web-search servers), and enable billing-bomb probe, opt-in only because the burst itself can run up real charges on paid third-party APIs.
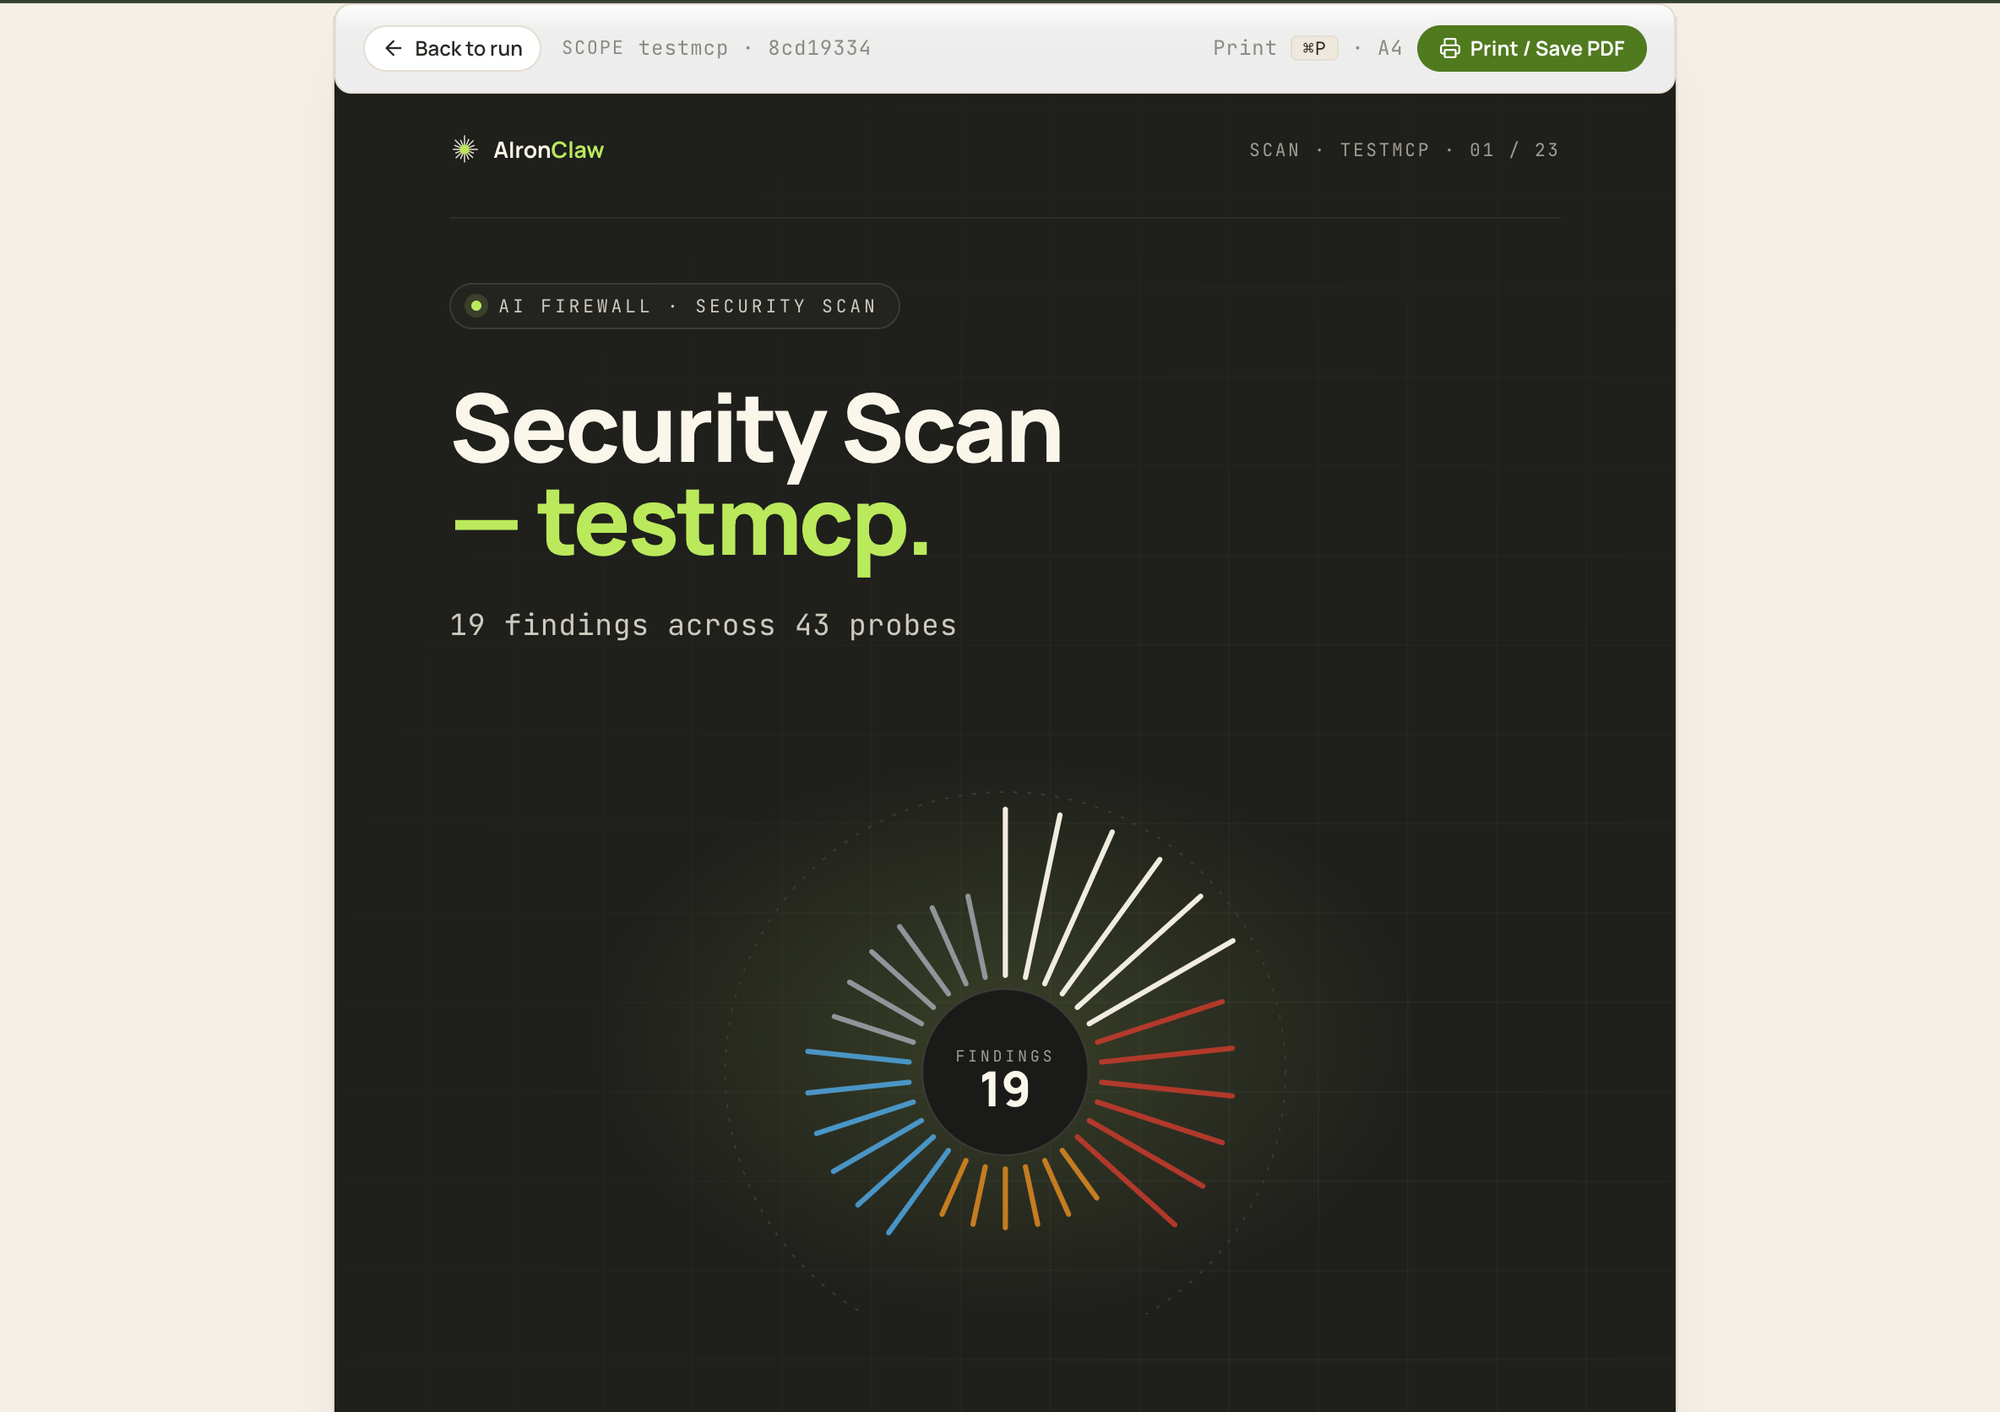
Every completed scan can be exported as an A4-sized printable report. Cover page with a severity sunburst summarising the distribution of findings. Executive summary with a posture pill (clean, attention, at-risk), four KPI cards, severity breakdown tiles, top three findings, an auto-generated narrative paragraph. Findings index. One section per finding with full description, evidence, proof of concept, remediation, references. Methodology appendix with scan parameters, per-probe request and finding counts, severity definitions. Print to PDF and it stays readable.
What is the AIronClaw Inspector for MCP?
The Inspector is the surgical end of the toolkit. The scanner is automated and broad. The Inspector is manual and deep. You pick an MCP proxy, choose a tool, set the arguments, fire the request through the gateway, and read the parsed response: status, headers, body, latency, and the firewall's decision if a rule fired.
The Inspector adds three things you don't get from a generic HTTP client:
- Schema-driven forms. When the selected tool ships an
inputSchema, the right pane renders the matching fields and validates types before sending. - Identity multiplexing. Pick which AIronClaw consumer the request is authenticated as: your own dashboard identity, one of your API keys, or no credentials at all. You verify per-key policy live without provisioning a separate test client.
- Saved cases. Persist any request as a case. Cases stay grouped by the MCP they belong to. Useful as a regression set after every rule change, as a repro set attached to a finding, as an onboarding aid for a new operator who needs to learn the tool catalog.
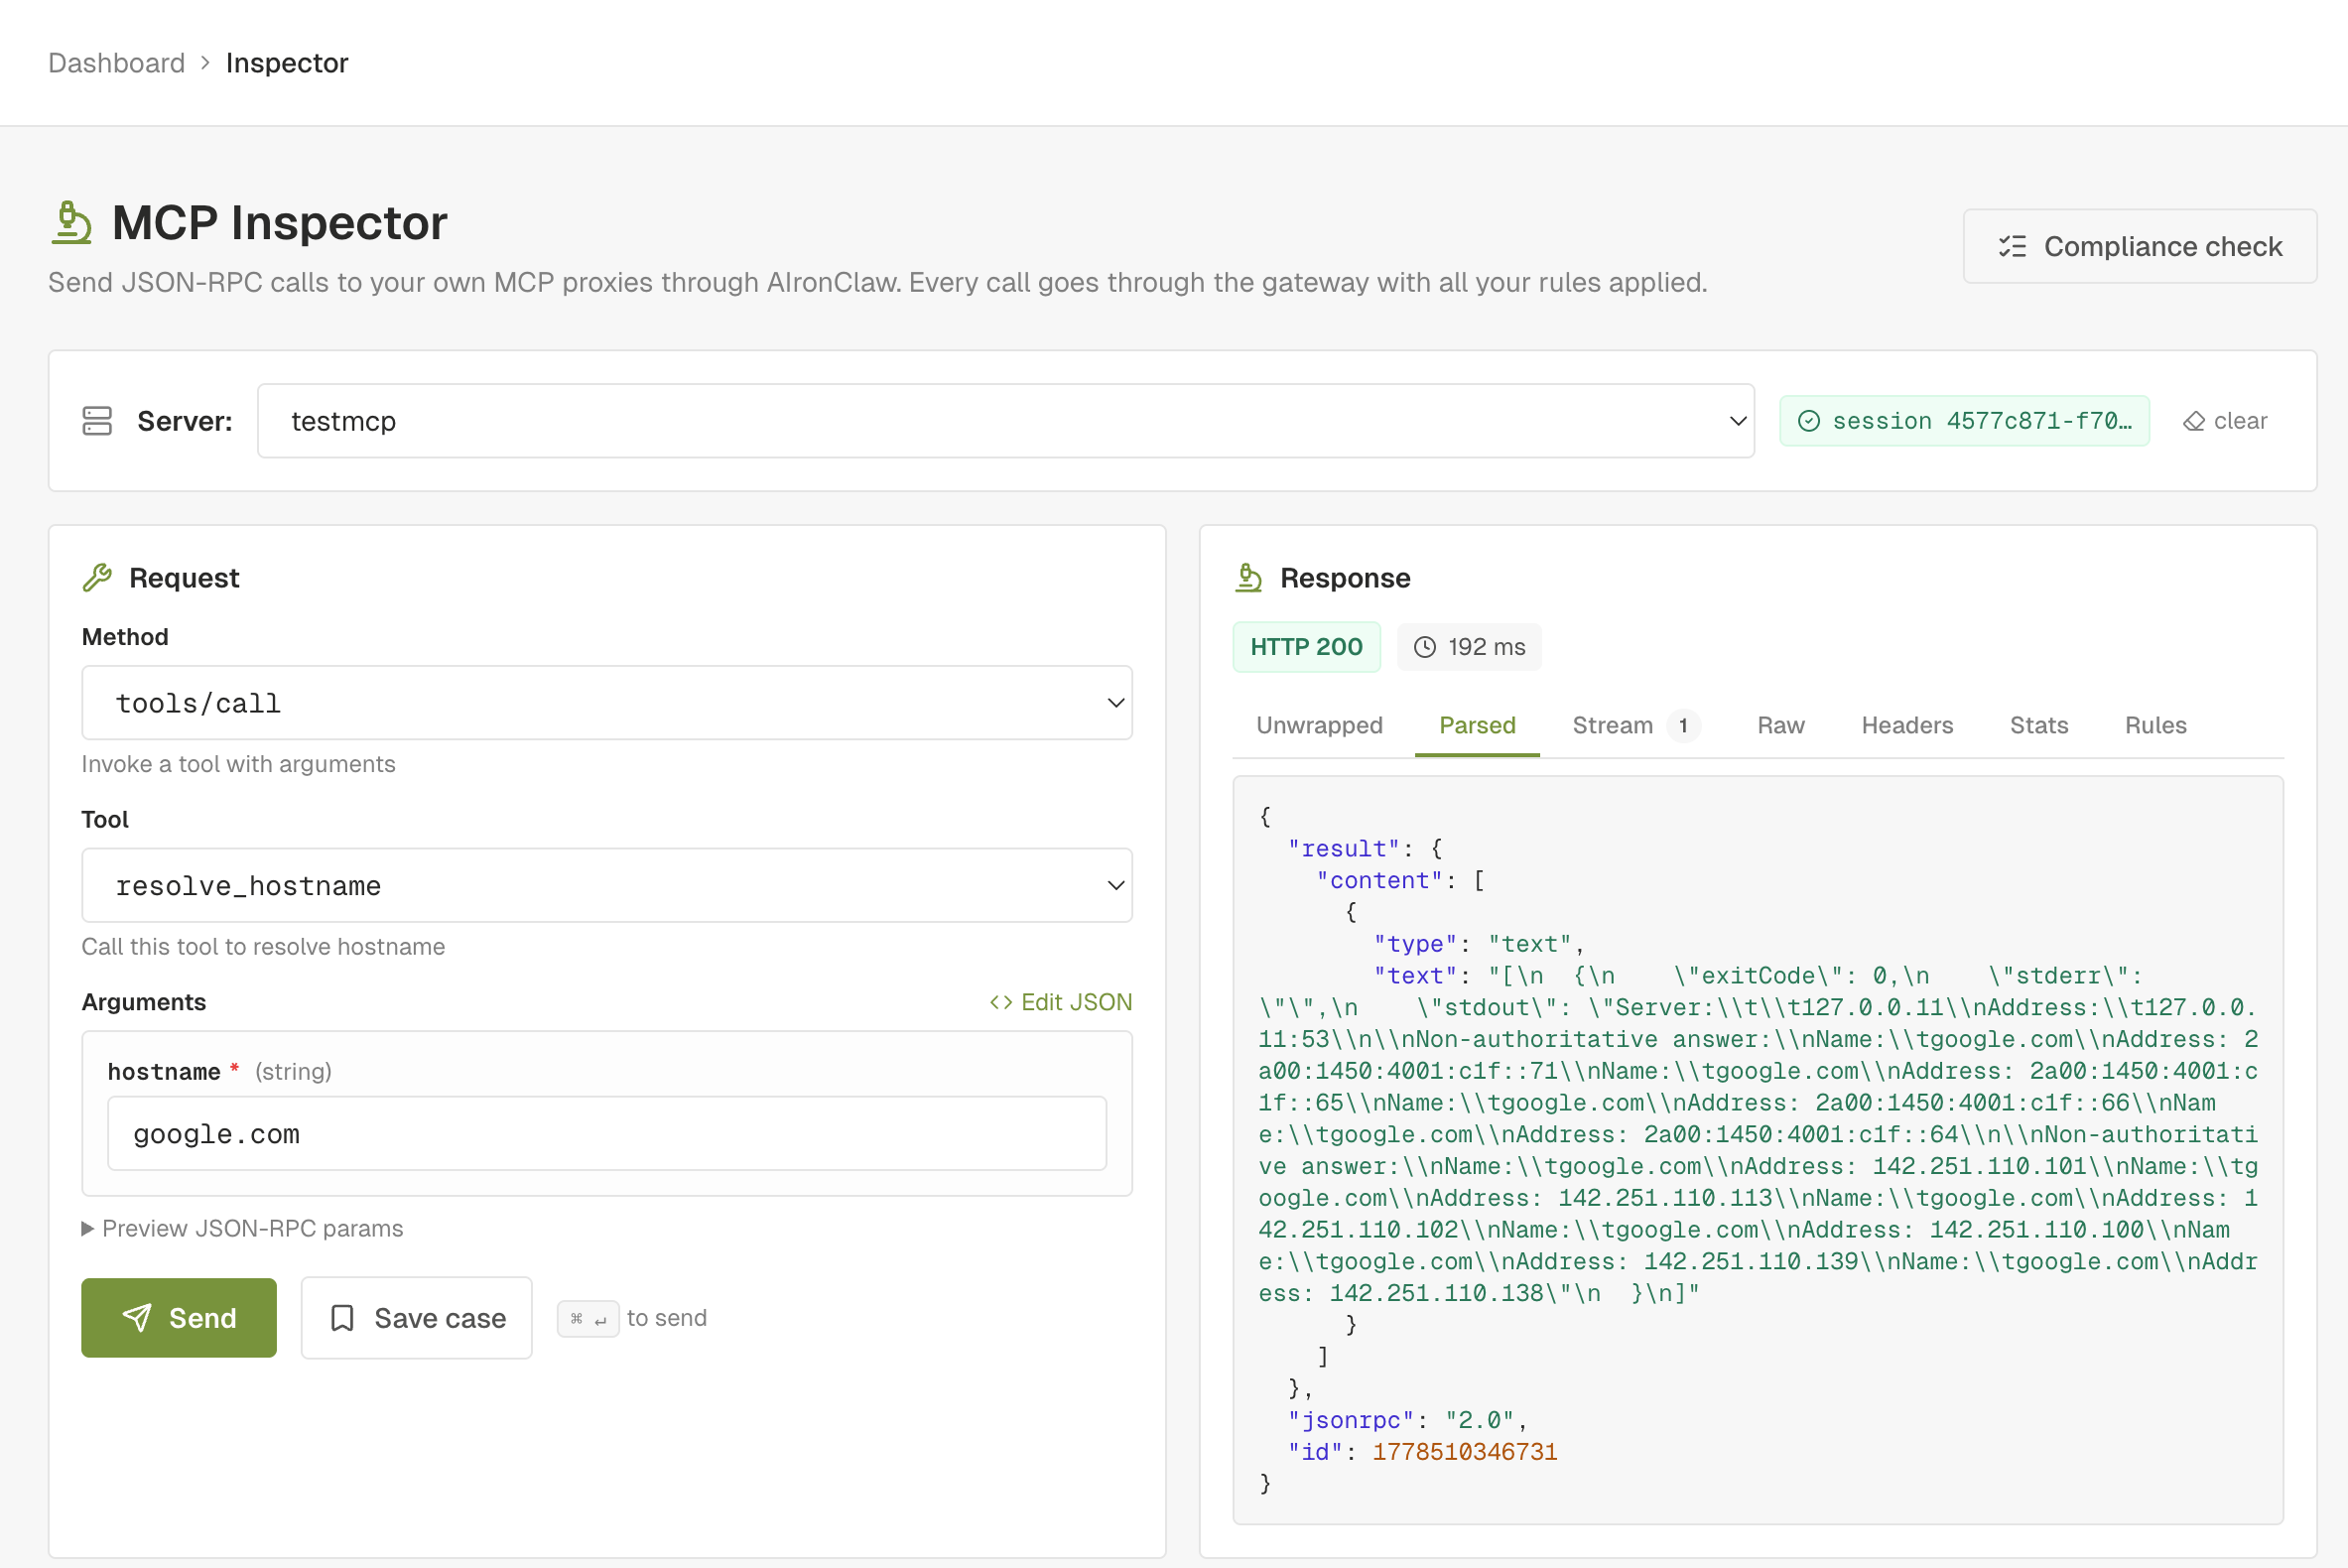
The Inspector closes the loop with the scanner. Every finding the scanner emits includes a replay envelope: the exact request that confirmed the vulnerability. A button on the finding card opens the Inspector with that envelope already filled in. From there you tweak, save, or rerun. After you apply a remediation rule and click Send in the Inspector, the response panel shows the firewall blocking or redacting the request, with the rule id that fired. That's the end-to-end remediation verified.
Every Inspector request transits the same gateway path that production traffic takes. The rules, the DLP, the prompt guards, the rate limits all apply. You're not testing the upstream raw. You're testing the upstream through the firewall configuration you actually use.
What is the AIronClaw MCP compliance check?
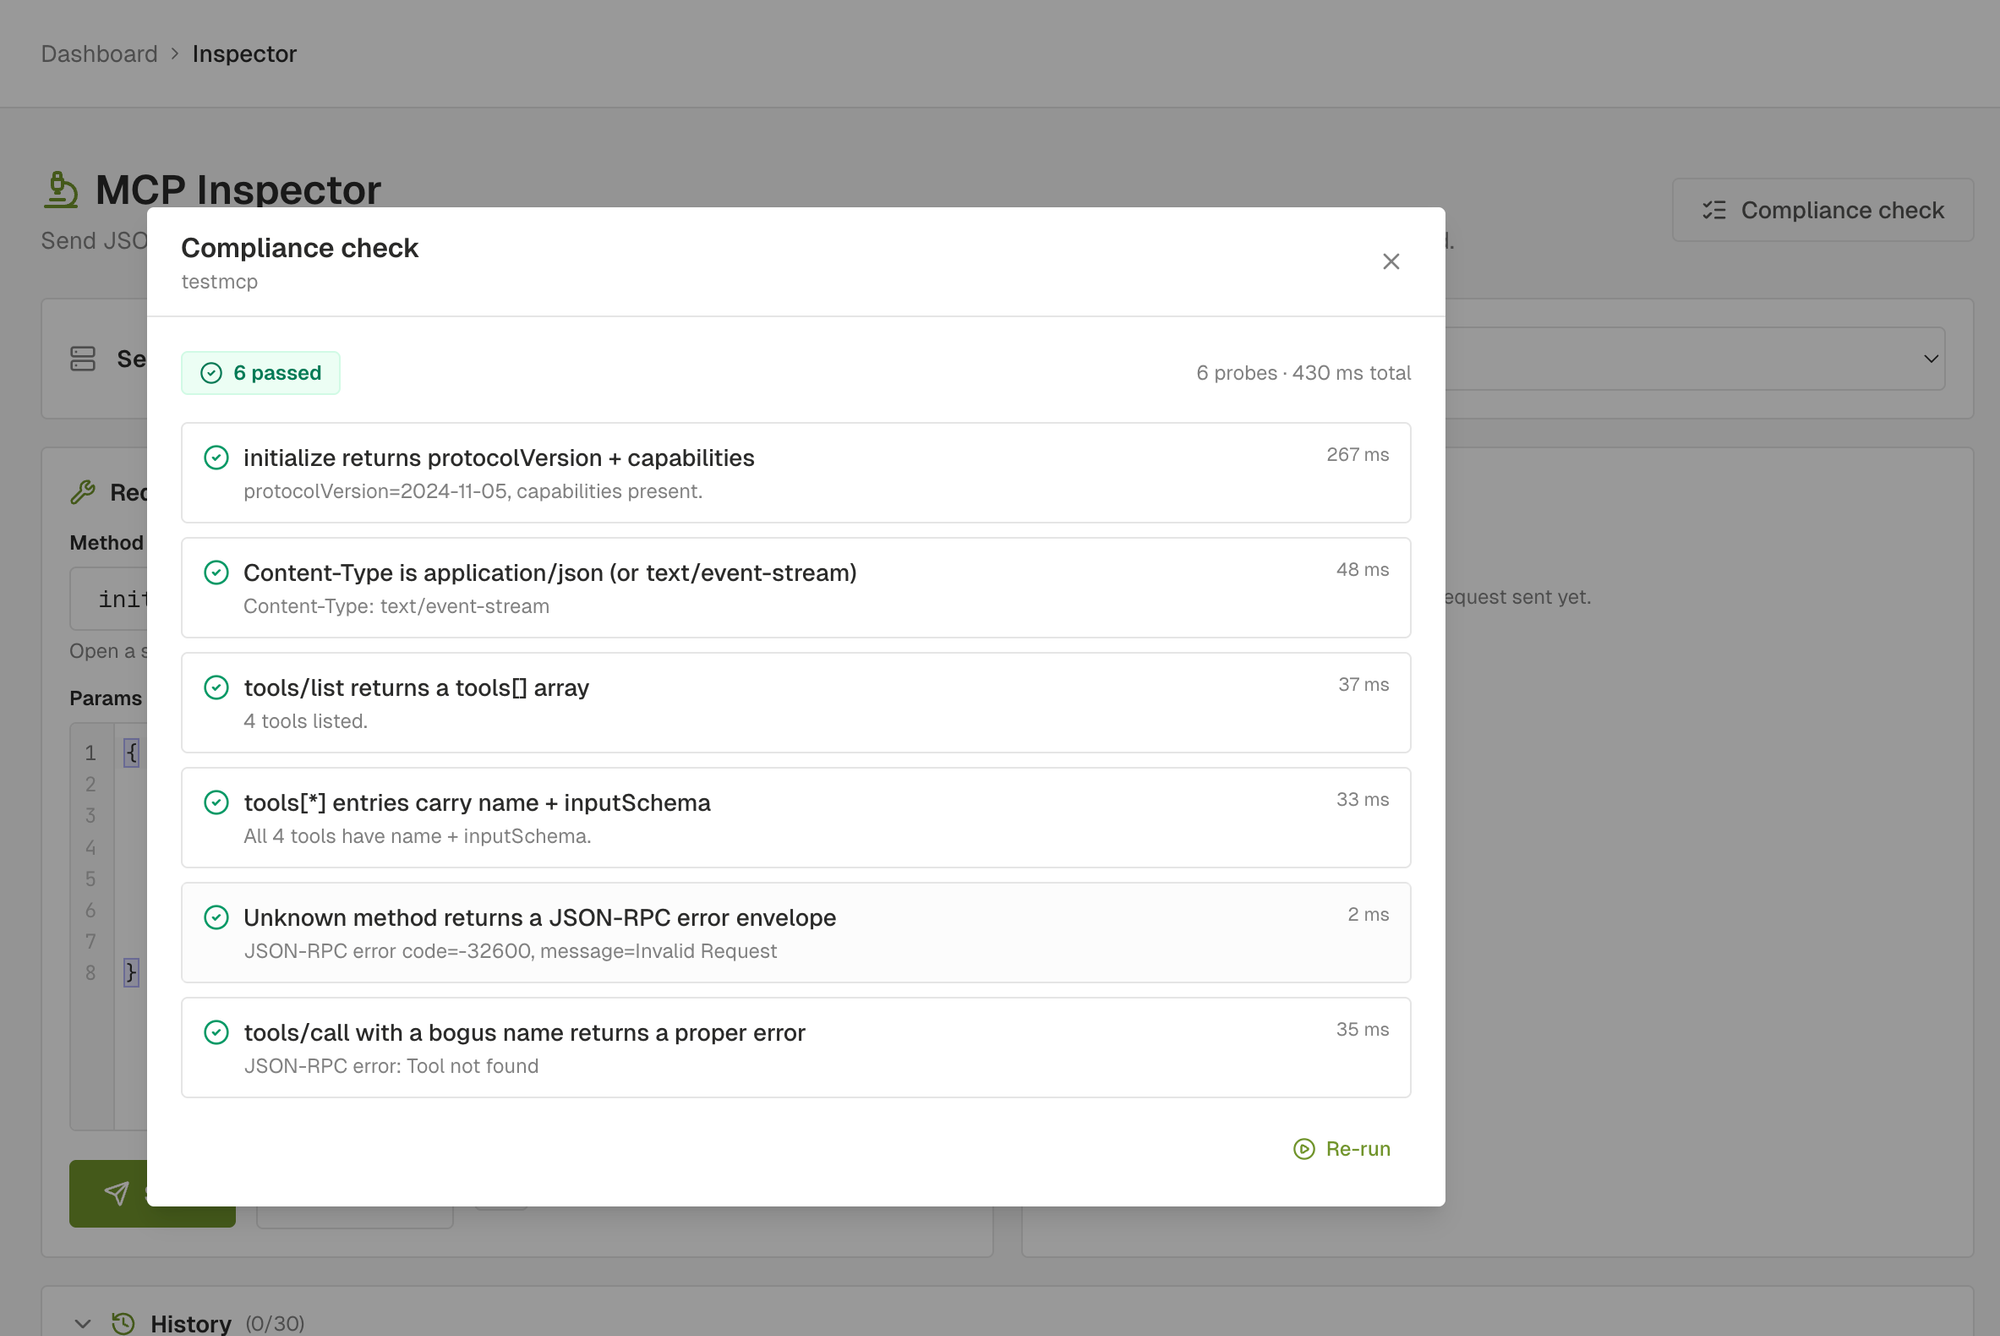
The compliance check is the cheapest of the three. Six probes, one to three seconds end to end, one verdict per probe. It answers one question: does this MCP server behave like the spec says it should?
The six probes:
initialize: handshake returnsprotocolVersionandcapabilities.content_type: response carriesapplication/jsonortext/event-stream.tools/list: server returns atools[]array.tool_shape: everytools[i]entry has a non-empty stringnameand an objectinputSchema.unknown_method: a JSON-RPC envelope with a method the server doesn't expose returns a proper error envelope, not a 200 with an empty body, not a 500 with HTML.bogus_tool_call:tools/callwith a tool name the server doesn't expose returns the same proper error envelope.
Each probe returns pass, warn, or fail. Pass is green: the server behaved as the spec describes. Warn is amber: we couldn't verify cleanly (a missing optional header, an unexpected but non-broken response shape, zero tools). Fail is red: the server diverged from the spec, clients that strictly follow it will misbehave.
The compliance check is not a security scan. A server can pass all six probes and still be wide open to injection. The two checks complement each other. Compliance proves the wire format is sane. Scan proves the implementation is safe.
The check has one job a security scan can't do as efficiently: triage. When a proxy starts throwing 5xx and you don't know whether the firewall or the upstream broke, the compliance check isolates the upstream-spec layer in one shot. If compliance is green, the upstream is fine. If compliance fails, you have the exact JSON-RPC envelope that broke it.
How do you gate an n8n MCP deploy on a clean scan?
The three tools wire into automation through a single personal access token. The simplest useful pipeline is "deploy an MCP, scan it, fail the rollout if anything critical or high lands". Here it is as an n8n workflow that runs on a schedule (or on a webhook from your CI).
The workflow has four nodes.
Node 1: Set (variables). Holds the constants for the run.
mcp_id: the UUID of the MCP you want to scan.base_url: your dashboard URL (defaulthttps://dashboard.aironclaw.com).token: your AIronClaw personal access token, taken from an n8n credential.
Node 2: HTTP Request (enqueue scan). POST {{ $node["Set"].json["base_url"] }}/api/mcp/{{ $node["Set"].json["mcp_id"] }}/scan with header Authorization: Bearer {{ $node["Set"].json["token"] }} and JSON body { "profile": "standard" }. The response carries runId. Save it into a workflow variable.
Node 3: Wait + HTTP Request loop. Poll GET /api/mcp/{{ mcp_id }}/scan/{{ runId }} every 5 seconds. Use an IF node on run.status to exit the loop when it equals completed, failed, cancelled, or aborted. n8n's built-in Wait node combined with IF does this without custom code.
Node 4: IF (gate on findings). Take the final scan response and check the findings count by severity:
const findings = $json.findings || [];
const criticalOrHigh = findings.filter(f =>
  f.severity === "critical" || f.severity === "high"
).length;
return [{ json: { criticalOrHigh, total: findings.length } }];
If criticalOrHigh > 0, the workflow takes the true branch and stops the rollout (Slack alert, Linear ticket, GitHub issue, your choice). If zero, the false branch proceeds to the actual deploy step.
The same workflow works as a daily security audit. Trigger on a schedule (every morning at 06:00), enqueue the scan, post the per-severity counts to Slack with the link to the printable report:
{{ $node["Set"].json["base_url"] }}/scan-report/{{ $json.run.id }}
That URL renders the A4 report directly. Print to PDF and attach the file to the Slack message for the audit log if you want a hard copy.
For a smaller setup the same flow fits on the command line. The agent skill ships a wrapper:
aironclaw scan run --mcp $MCP_ID --wait --fail-on high
The CLI enqueues, polls until terminal, prints the by-severity breakdown and the top 20 findings, and exits non-zero when any finding at or above the chosen severity exists. Drop it in CI as a gate (GitHub Actions step, GitLab CI job, Jenkins shell step). Same outcome as the n8n workflow above, fewer moving parts.
How the three fit a real workflow
Each tool has its place. Together they cover the lifecycle of an MCP from first wiring to ongoing operation.
Onboarding a new MCP. Run the compliance check first. It takes seconds. If anything fails, fix that before doing anything else. A non-spec-compliant server isn't worth security-testing until the wire format is healthy.
Pre-production hardening. Once compliance is green, run a full Security Scan. Set the target profile if you know the upstream stack. Wait for the run to complete, work through the findings list top down (critical, then high, then medium). For findings that ship a suggested rule, apply the rule, then click Open in Inspector on the finding and rerun. You should see the firewall blocking or redacting the payload that surfaced the finding.
Triage when something goes wrong in production. A specific request is failing or returning the wrong shape. Open the Inspector, fire the exact envelope from a real call (you can paste the curl, or build it from the schema form), watch what happens. The Inspector shows the firewall's decision if a rule fired, the upstream's response if it didn't.
Regression on every rule change. Save the post-scan replay envelopes as Inspector cases. After any rule change, replay the case set. Anything that used to be blocked and is now allowed (or vice versa) is the rule change you just shipped.
Periodic security audit. Schedule the Security Scan on a cadence that fits the upstream's release pace. Weekly is reasonable for an MCP you change often, monthly for a stable one. The scanner runs against the live configuration so it catches the regressions an unconfigured-rules-file would miss.
What the workflow buys you
Two things, and they're not subtle.
First, you ship MCPs you've actually probed. Not "we assumed the upstream sanitises inputs". Not "the team that wrote the MCP server is good". Probed, with real payloads, against the real configuration. A clean scan is a positive statement.
Second, you have a record. The findings list with severities, the printable report, the saved Inspector cases, the suggested rules you applied. When the next auditor asks how you verified the MCP is safe, you have an answer that fits on one page and a PDF that fits in an email.
The three tools are live in the AIronClaw dashboard today. The full API surface is documented under /docs/security-scan, /docs/inspector, and /docs/compliance. The agent skill at /skill ships CLI wrappers (aironclaw scan run --mcp <id> --wait --fail-on high, aironclaw inspect call, aironclaw compliance check) for CI gates and scripted workflows.